|
用这个词文件作为你的答案的形式。你会找到有标签但没有结果的表格——在回答你的任务时,你需要填写这些表格。
Use this word file as the pro forma into which you incorporate your answers. You will find tables with labels but no results – in answering your assignment you will need to fill these tables.
在电子表格“cw data.xlsx”中,您将找到用于分配的数据。在B栏中,您将看到S&P500指数(市场指数)的价值,在C栏中,您将看到美国国债的月收益率,该收益率被视为无风险回报率。在D列到TN列中,您将看到S&P500中组件库存的价格数据。你们每个人都将使用其中一只股票的数据以及市场指数和国库券收益率来完成这项任务。在第1行中,您将看到一个注册号列表——您将用于分配的库存在带有注册号的列中,因此您首先需要找到您的注册号。一个简单的方法是使用Excel中的“查找”工具。确保您选择了“主页”选项卡,在菜单栏的最右边,您应该看到一张名为“查找和选择”的双筒望远镜图片–单击此按钮,键入注册号,然后按回车键,直到找到以注册号为标题的四列。
In the spreadsheet “cw data.xlsx” you will find data to be used for your assignment. In column B you will see the value of the S&P500 index (the market index) and in column C you have the monthly yield for US Treasury Bills that is viewed as the risk free rate of return. In columns D through to TN you will see price data for component stocks from the S&P500. Each of you will be using data for one of the stocks along with the market index and the Treasury Bill yield to complete this assignment. In row 1 you will see a list of registration numbers – the stock you will be using for your assignment is in the column with your reg number so you first need to locate your registration number. An easy way of doing this is to use the ‘find’ facility in excel. Make sure you have the “Home” tab selected, look to the far right of the menu bar and you should see a picture of binoculars titled “Find &Select” – click on this, type your reg number and press return until you find four columns headed by your reg number.
Tips and guidance:
First select and copy your data (the price data for the stock, the market index and the Treasury Bill yield) into a separate Excel file within which you can undertake the necessary calculations.
Essential: You must report your answers in the tables and spaces provided below. Be sure to clearly explain your results and where appropriate use the equation editor to present any formula or equations that you find necessary – you will find this on the Insert tab towards the far right of the menu bar.
For Part 1, you can make full use of functions within Excel to calculate the statistics. For Part 2, you are advised to use the regression facility in data analysis which you should find on the Data tab. For Part 3, you will make use of information from Bloomberg.
If you haven’t got data analysis on your data tab, see this short video for how to enable it https://www.youtube.com/watch?v=6nCP65Nbm0E (Excel 2007)
When you have completed your work upload both the word file and the Excel file to FASER.
The Deadline is 9.00am on 24 March, but I strongly recommend that you upload before this date. Remember, there is a zero tolerance policy for late submission so it is good practice to save a draft of your work, even if it is partially complete, to FASER a few days before the deadline which you can save over with the final version once you have completed the work. By doing this should you have any last minute unforeseen accidents (e.g computer failures) then you have some work that we can mark.
Name:
Registration number:
Module (BE300 or BE302):
PART ONE (20 marks)
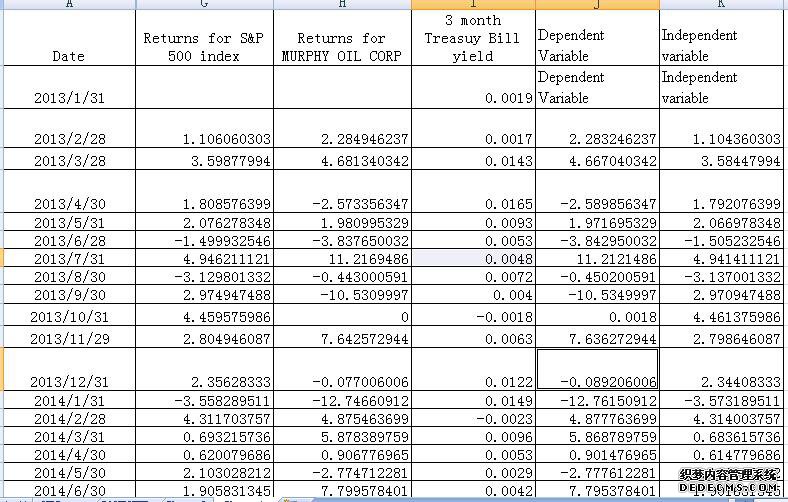
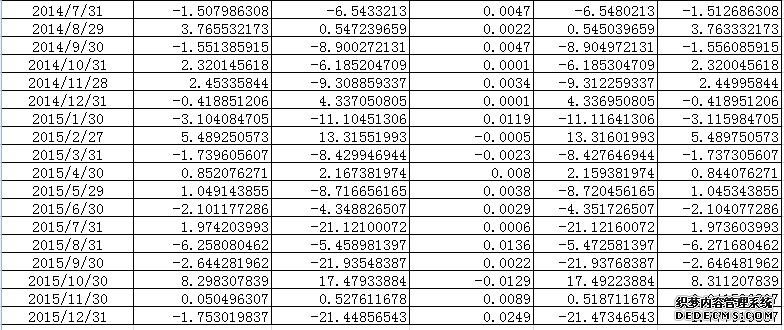
The first thing you need to do is calculate the returns for the market index and your stock. Note: the Treasury Bill yield is a rate of return so you do not need to calculate this. The value of 0.000249 in December 2015 means that the monthly yield or rate of return on 3 month T. Bills was 0.0249%. To make it easier on the eye, you could multiply the yields by 100 if you wish but if you do this you must do the same for the stock and index returns when you calculate those.
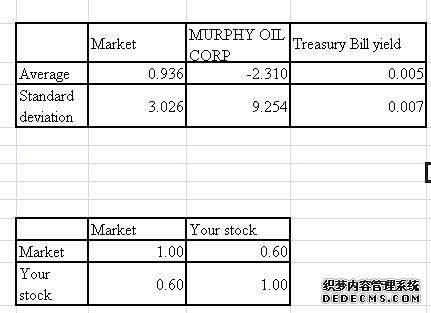
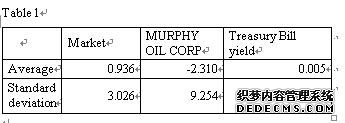
To calculate the returns for the stock and indexyou simply calculate the percentage change in price month by month – note, this ignores dividends but this is fine for our purposes. The important thing is to calculate these returns on a consistent basis with the Treasury Bill yield which is monthly. Since there are 36 months of price data you should have 35 months of returns. Calculate the average return and standard deviation for the returns of your stock the index and the Treasury Bill and insert the results in Table 1; choose an appropriate number of decimal places in order to make the results easy on the eye.
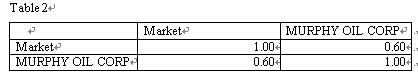
Complete the correlation matrix in Table 2. To do this you might find the excel function correl useful. Present the correlations using two decimal places.
Provide a brief commentary on the results in tables 1 and 2 linking it to your knowledge of finance (max 150 words)
The formula of rate of return is Return_t=(Price_t-Price_(t-1))/(Price_(t-1) ). In order to make returns easier on the eye, I would multiply all the returns by 100. After multiplying returns by 100, the average of returns of MURPHY OIL CORP, index returns and Treasury Bill yield are -2.310, 0.936 and 0.005 respectively. The standard deviation for the returns of MURPHY OIL CORP, index returns and Treasury Bill yield are 9.254, 3.026 and 0.007 respectively. The formula of coefficient of variation is CV=(Standard deviation /average )*100%. Thus, the coefficient of variation for the returns of MURPHY OIL CORP, index returns and Treasury Bill yield are 400.6, 323.4 and 124.4 respectively.
The correlation coefficient between the returns of MURPHY OIL CORP and the market index is 0.60. Thus, the returns of MURPHY OIL CORP is positively and linearly correlated with the returns of market index at a moderate degree.
PART TWO (50 marks)
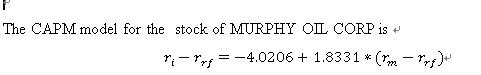
Estimate the CAPM for your stock. The formula for the CAPM is
r_i=r_rf+β_i (r_m-r_rf )
You will use the regression tool in excel to estimate the CAPM. First you need to rearrange the equation by subtracting the risk free rate from both sides and allow for an intercept which we call alpha () giving the empirical version of the CAPM
r_i-r_rf=α_i+β_i (r_m-r_rf )
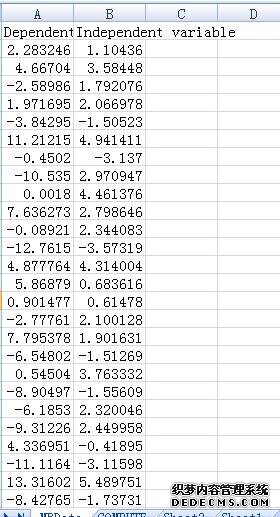
In order to estimate this regression you first need to construct the variables. You create the y-variable (also known as the dependent variable) by subtracting the risk free rate (the Treasury Bill yield) from the returns of your stock and you create the x-variable (the independent variable) by subtracting the risk free rate from the return on the market (the S&P 500). The regression tool will enable you to estimate the values of alpha (the intercept) and the beta (the slope coefficient).
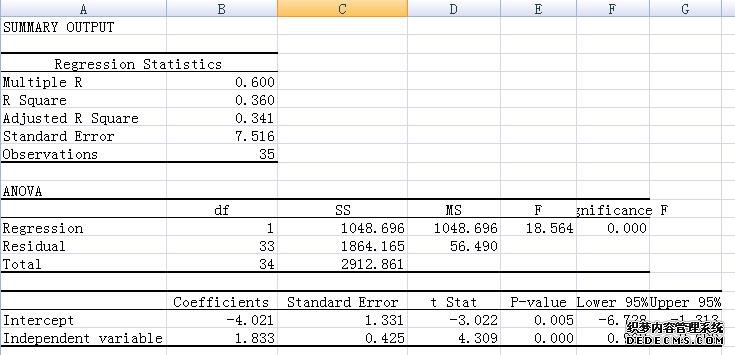
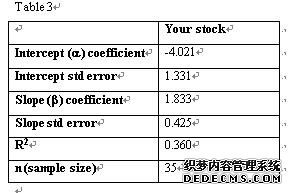
Record the essential information from the regression in Table 3.
Conduct hypotheses tests on the intercept and slope coefficient to see if the intercept is significantly different from zero and the slope coefficient is significantly different from one (hint: be sure to clearly present the null and alternative hypotheses, the test statistics, critical values and degrees of freedom) (max 150 words)
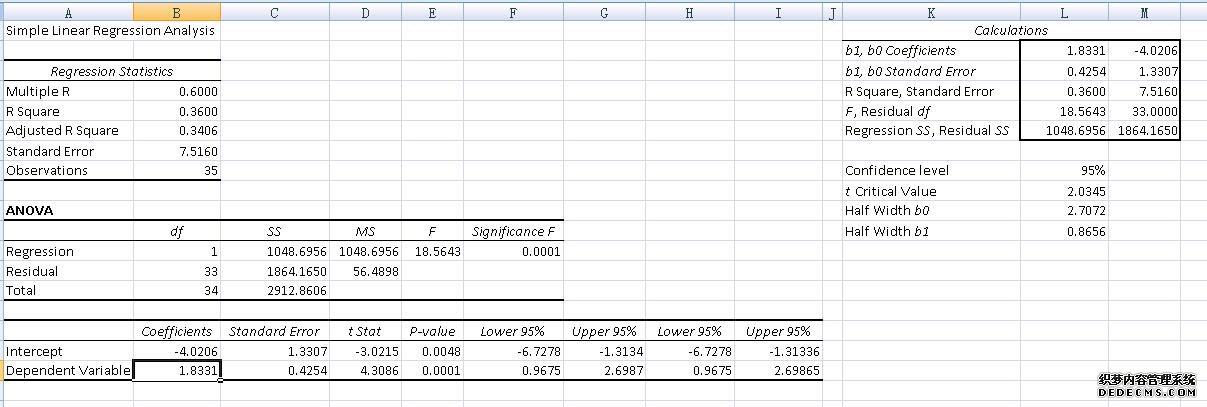
The level of significance is 5%. The null hypothesis on the intercept is H_0:α=0, and thealternative hypothesis on the intercept is H_a:α≠0. The degree of freedom is 33, and the critical values of the t test is T_33,0.025=2.0345. However, the test statistics for t test on intercept is -3.0215. The absolute value of the test statistics is 3.0215>2.0345, which reject the null hypothesis at 5% level. Thus, the intercept is significantly different from zero.
The null hypothesis on the slope is H_0:β-1=0, and thealternative hypothesis on the intercept is H_a:β-1≠0. The degree of freedom is 33, and the critical values of the t test is T_33,0.025=2.0345.The test statistics for t test on the slope is t= (β-1)/(se(β))=(1.8331-1)/0.4254=1.958.#p#分页标题#e#
Thus, the test statistics 1.958<2.0345, which cannot reject the null hypothesis. Therefore, the slope coefficient is not significantly different from one.
Interpret the intercept and slope coefficients – what are they telling us? (max 150 words)
In theCAPM model, the intercept () coefficient is -4.0206, which means that mean value of dependent variable (r_i-r_rf) is -4.0206, when the independent variable (r_m-r_rf) =0.
The slope () coefficient is 1.8331, which means that the dependent variable (r_i-r_rf) increases by 1.8331, on average, for each additional increase in independent variable (r_m-r_rf). In other words, when the independent variable (r_m-r_rf) increases by one unit, the dependent variable r_i-r_rf will increase 1.8331.
Interpret the R2 of the regression – what is it telling us? (max 100 words)
The R2 of the regression is the ratio of SSR to SST, which measures the proportion of variation in dependent variable that is explained by the independent variable in the regression model. In this CAPM model, the R2 of the regression is 0.36, which means that 36% of the variation in dependent variable (r_i-r_rf) is explained by the variability in independent variable (r_m-r_rf).
PART THREE (30 marks)
Find your stock on Bloomberg. Hint: be careful to choose the equity of the company and not some other debt instrument. Use the ANR function to find information on analyst recommendations. Save a screenshot and insert into this file and then provide a commentary
Insert screenshot here
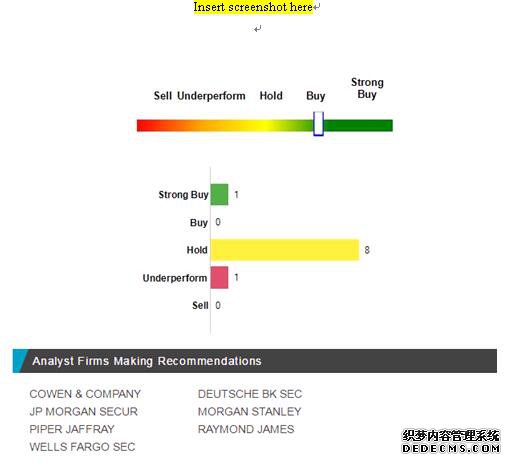
Comment on the analyst recommendations. Each of you is looking at the recommendations for a different stock so there is no one way of answering this question. I suggest you focus on whatever is striking about the recommendations for your stock. You may want to consider: the degree of consensus or disagreement; the change in recommendations over time; the comparison of target and actual price; etc. If it helps your discussion, you can include an additional Bloomberg screenshot if relevant, but you must stay within the word count (max 200 words)
The slope () coefficient refers to the risk measurement between the selected security and the market index. If the slope () coefficient is larger than 1, the expected rate of return on the selected stock is larger than the market index. In other words, the larger the coefficient of CAPM, the greater expected rate of return on the selected stock. In the CAPM model, the fluctuating range of my selected stock is 1.8 times the S&P 500 index. However, the α coefficient denotes thereturns of non-market, which can measure the manager performance. The α coefficient is larger than 0 means that the manager performance is good. However, in the CAPM model, the manager performance is less than the uncertainties future, which cause uncertainty returns of future.
According to Bloomberg, most analyst recommends that I should hold the stock. Since the greater expected rate of return on the selected stock and the uncertainties future, I agree with this recommendation.
|
| 网站地图 |


