|
I. Introduction: states the objectives of the project 介绍:项目的目标
在2016美国总统竞选,每个状态取决于两个主要因素:网上投票和各党派的选民的性别。
这个问题对美国的人们来说很重要,世界上其他的人们以及2016个总统候选人本身。2016个美国总统竞选的结果与美国的经济、健康、政治和安全有关。鉴于美国的全球地位,导致世界经济的领先地位,2016年代的选举结果也与世界的经济和政治有关。对于候选人本身,重要的是要了解选举结果和不同的因素之间的关系,以预测在下一个州的选票,在已完成投票的州的数据。 2016年美国总统竞选活动仍是一个持续的过程,直到十一月,2016年是令人兴奋的每天晚上投票星期二之前建立一个数据驱动的多元回归模型。到目前为止,2016年美国总统竞选没有多元回归模型建造。车型将在今年改变的一年,因为票数决定因素将发生变化。在一些年来,恐怖主义可能是一个问题;在其它年份,经济可能是一个问题。因此,这将是不科学使用旧的2012美国总统竞选模型来预测2016年竞选的结果。
The objective of this paper is to investigate the question on how the final statewide votes for Republican and Democratic candidates, in the 2016 US president campaign, of each state depend on two major explanatory factors: the online polls and the gender of voters for each party.
This question is important for the people in the US, the people in the rest of the world, and the 2016 US president candidates themselves. The outcome of the 2016 US president campaign is related to the economy, health, politics and safety to the US. Given the global status of the US, leading the economy of the world, the outcome of 2016’s campaign is also related to the economy and the politics of the world. For the candidates themselves, it is important to understand the relation between the election results and different factors, in order to forecast the votes in the next state from the data in the states that have finished voting. The 2016 US president campaign is still an ongoing process till November, 2016. It is exciting to build a data-driven multiple regression model before every voting night on Tuesdays. No multiple regression models were built so far for the 2016 US president campaign. Models will change year by year because the deciding factors of the votes will change. In some years, the terrorism might be an issue; in other years, the economy might be an issue. Therefore, it will be unscientific to use the old 2012 US president campaign model to predict the outcomes of 2016 campaign.
This paper is going to answer this question by building a multiple regression model of the final statewide polls for the states, that have finished voting, to forecast the final votes of Republican and Democratic winners of the New York states, which will happen on 19/04/2016, through statistical means in Econometric business forecasting. This paper is organised as the follows. In Section II, a literature review of past statistics modelling of US presidential campaign is presented. In Section III, the data of the multiple regression model is collected and its descriptive statistics is presented in tables and figures. In Section IV, the multiple regression model of this paper is explained. In Section V, the parameters in the model is estimated and the hypothesis is tested. In Section VI, a brief summary is provided along with the business forecast of the 2016 US presidential campaign results in the New York state.
II. Literature review文献综述
Several factors can influence the outcome of the 2016 US president campaign. Among them, the major factors are the party of the candidate (Republican or Democratic), how the candidate is going to create new jobs, how the candidate is going to boost the US economy, how the candidate is going to improve the education, how the candidate is to solve the terrorism problem and scandals (L.J. Sabato et al, 2015). From the CNN exit polls, the voters from the Republican side and the Democratic side weigh differently on these factors state by state (CNN politics, 2016).
Past work has been done on building multiple regression models for the outcomes of votes in US president campaigns. A multiple regression model is built to relate the US presidential elections to the US economy (R.K. Roth, 2012). In 2012, a multiple regression model discovered that the unemployment rate as a major factor in the 2012 US presidential campaign (P. Sinha et al, 2012). In this paper, a different approach is adopted to predict the statewide votes from the online polls. Among all the online polls, the Real Clear Politics (RCP) averaged polls considered all the online up to date polls (Real Clear Politics, 2016). This is similar to Nate Silver’s regression model based on polls at the state level for the 2012 campaign (N. Silver, 2013). Nate Silver used the Public Policy Polling (PPP) (Public Policy Polling, 2016), however the RCP averaged polls will be used in my model because RCP averaged polls have included nearly all the online polls, including the PPP results. From the statewide exit polls on CNN exit polls, the votes in each state are sensitive to the percentage of male voters during the exit polls (CNN politics, 2016).
III. Data数据
The 2016 US president campaign is still an ongoing process till the end of 2016. The source of the data being used to build a multiple regression model is explained as the follows. For the states that have finished the voting process, either through caucuses or primaries (K. Lewis, 2016), the votes for the winner, for both the Republican and the Democratic sides, are collected state by state in percentages from the CNN politics (CNN politics, 2016). The statewide votes form the data of the dependent variable. The RCP averaged votes for the winner, either from the Republican or from the Democratic side, in each voted states are collected in percentages from the RCP (Real Clear Politics, 2016). The statewide male percentage, both from the Republican and the Democratic sides, during the exit polls are collected state by state from the CNN exit polls (CNN politics, 2016). Both the RCP averaged votes for the winner of the states, denoted as RCP_R and RCP_D for the Republic and the Democratic, and the statewide male percentage, denoted as MEN_R and MEN_D for the Republic and the Democratic, during the exit polls are regarded as explanatory variables in this model. Besides that, a dummy variable (I) is introduced to label the Republican party (I = 1) and the Democratic party (I = 0). 34 observations are made from the winners of 34 voted states either on the Republican and Democratic sides. Please see the attached Excel file for the data.
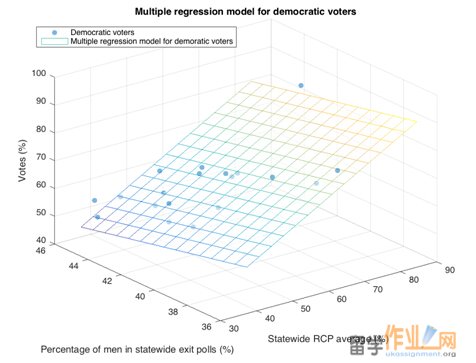
A scattered plot of votes (denoted as VOTE) versus RCP_R and MEN_R, or RCP_D and MEN_D is shown in Figure 1. From Figure 1, we see that the data points almost lied on a plane, indicating that a multiple linear regression model might be a good fit for the data.
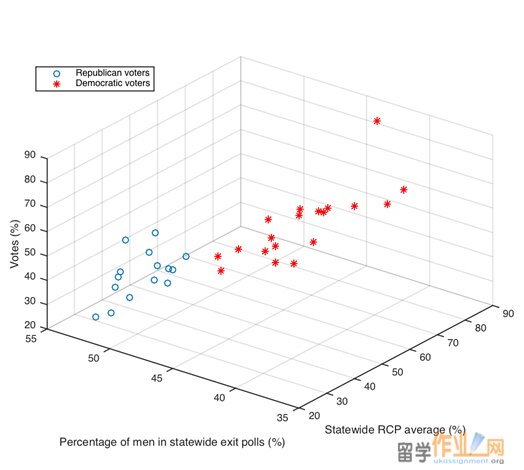
Figure 1: 3D scatter plot of statewide votes of winners VOTE (in %) versus statewide RCP average (in %) and percentage of men in the statewide exit polls. 34 observations in total.
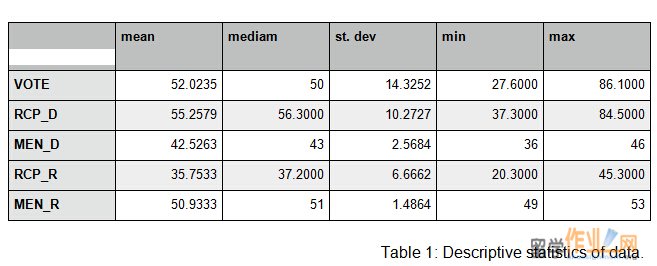
The descriptive statistics of the collected data are presented in Table 1.
mean mediam st. dev min max
VOTE 52.0235 50 14.3252 27.6000 86.1000
RCP_D 55.2579 56.3000 10.2727 37.3000 84.5000
MEN_D 42.5263 43 2.5684 36 46
RCP_R 35.7533 37.2000 6.6662 20.3000 45.3000
MEN_R 50.9333 51 1.4864 49 53
 #p#分页标题#e# #p#分页标题#e#
Table 1: Descriptive statistics of data.
IV. Model specification模型规范
Let VOTE be the dependent variable, as the final statewide votes of the winner on the Republican side or the winner on the Democratic side. Let RCP_D, MEN_D, RCP_R, MEN_R be the explanatory variables. I is a dummy variable, where I = 1 is for the Republican and I = 0 is for the Democratic. Let the population regression function (PRF) be
VOTEi = I * R0 + (1-I) * D0 + I * R1 * RCP_Ri + I * R2 * MEN_Ri + (1-I) * D1 * RCP_Di + (1-I) * D2 * MEN_Di + Ui, (1)
where Ui is the random error. With a sample of n = 34 observations of VOTE, RCP_R, RCP_D, MEN_R, and MEN_D, an estimation of coefficients R1, R2, D1, and D2 may be denoted as r1, r2, d1, and d2, respectively. Hence, the sample regression function (SRF) is
VOTEi = I * r0 + (1-I) * d0 + I * r1 * RCP_Ri + I * r2 * MEN_Ri + (1-I) * d1 * RCP_Di + (1-I) * d2 * MEN_Di + ei, (2)
where r1, r2, d1, and d2 can be estimated by Ordinary Least Squares (OLS) and ei is the error. This SRF is my multiple linear regression model.
V. Analysis分析
V.1 Diagnostic tests of assumptions in Classical Linear Regression Models 经典线性回归模型中假设的诊断检验
A few assumptions from the classical linear regression model must be met by the multiple regression model, given in Equations (1) and (2). Besides the assumptions that the expectation of the disturbance Ui shall be close to 0, homoscedasticity, no autocorrelation between the disturbance Ui, zero covariance between ui and explanatory variables, the number of observation (34) being larger than the number of explanatory variables (4), there are two things to check: first is the variability in explanatory variables; second is multicollinearity.
According to Table 1, the smallest variability among the explanatory variables is in MEN_R, which is (53 - 49) = 4 out of an average of 50.9333. This is about to be 4/50.9333 = 7.9%. Critically speaking, if there is any weakness of this model, this might be a weakness. The variabilities in other explanatory variables are all much larger than MEN_R.
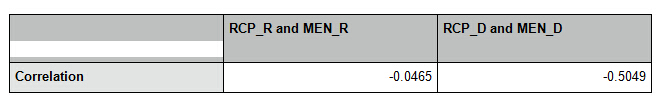
A good multiple linear regression model would not allow multicollinearity among the explanatory variables. Therefore, a diagnostic test is done to compute the correlation between RCP_R and MEN_R, and between RCP_D and MEN_D. The results are shown in Table 2.
RCP_R and MEN_R RCP_D and MEN_D
Correlation -0.0465 -0.5049
Table 2: check the multicollinearity between explanatory variables by computing the correlations.
From the correlation checked between RCP_R and MEN_R and between RCP_D and MEN_D shown in Table 2, this multiple regression model is a better model on the Republican side as there is less correlation between the two explanatory variables for the Republicans than the correlation for the Democratic.
V.2 Parameter estimation in the multiple regression model多元回归模型中的参数估计
By multiple linear regression, the following model with estimated parameters is obtained on the Republican’s side to predict the statewide votes of the Republican winner:
VOTE = 41.9299 + 0.7433 * RCP_R - 0.5649 * MEN_R. (3)
The following model with estimated parameters is obtained on the Democratic’s side to predict the statewide votes of the Democratic winner:
VOTE = 75.2672 + 0.7586 * RCP_R -1.3042 * MEN_R. (4)
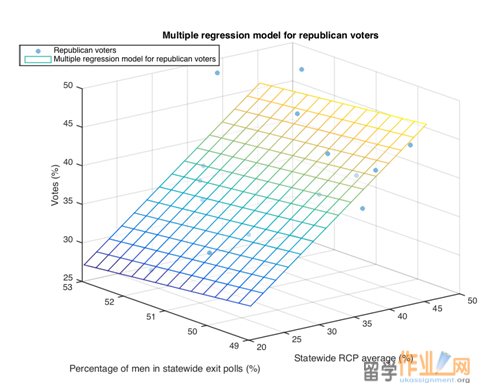 
Please see Figure 3 and Figure 4 for the multiple linear regression model for the Republicans and the Democratic respectively.
Figure 2: Republican’s multiple regression model (plane) and observational data (dots).
Figure 3: Democratic’s multiple regression model (plane) and observational data (dots).
V.4 Discussion of estimated parameters and hypothesis testing讨论参数估计和假设检验
The parameters estimation in Equations (3) and (4) for Republican’s and Democratic’s multiple regression model are analysed in Tables 3 and 4 respectively.
coefficients estimates lower bound of 95% confidence interval upper bound of 95% confidence interval
r0 41.9299 -42.2730 126.1328
r1 0.7433 0.3818 1.1048
r2 -0.5649 -2.1861 1.0563
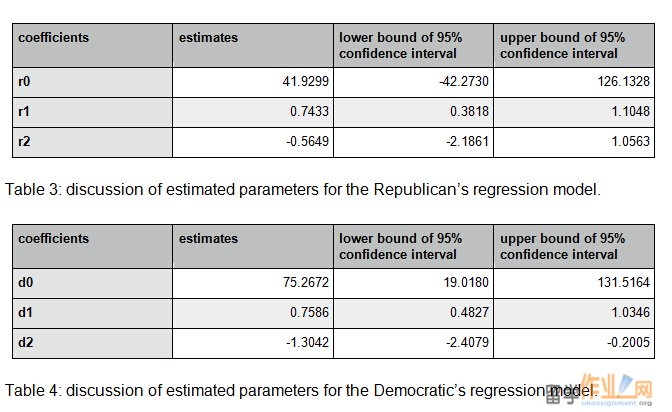
Table 3: discussion of estimated parameters for the Republican’s regression model.
coefficients estimates lower bound of 95% confidence interval upper bound of 95% confidence interval
d0 75.2672 19.0180 131.5164
d1 0.7586 0.4827 1.0346
d2 -1.3042 -2.4079 -0.2005
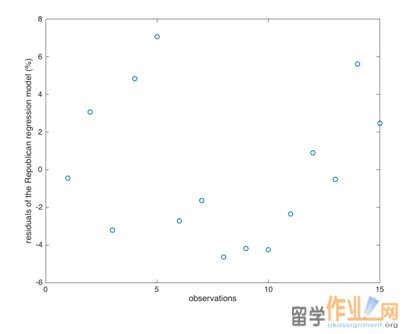 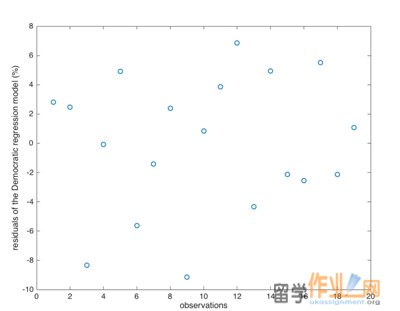
Table 4: discussion of estimated parameters for the Democratic’s regression model.
The residuals from the data of the Republican votes and the Democratic votes are plotted in Figures 4 and 5. From the Excel data attached, no outliers are detected both on the Republican and the Democratic side at the 95% confidence interval. The residuals are almost randomly distributed in space.
Figure 4: Residuals of the Republican votes’ observations.
Figure 5: Residuals of the Democratic votes’ observations.
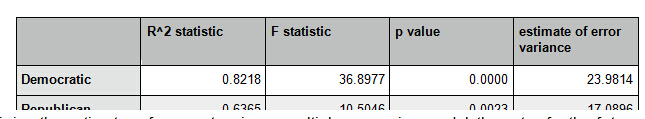
Table 5: more hypothesis testing statistics of the Republican and the Democratic multiple regression models.
From Tables 3 and 4, all the estimated coefficients r0, r1, r2, d0, d1, and d2 lie inside the 95% confidence intervals. Therefore, the hypothesis of the estimated values of coefficients r0, r1, r2, d0, d1, and d2 is accepted.
V.5 Prediction and forecastingV.5预测预报
After obtaining the estimates of parameters in my multiple regression model, the votes for the future winner in the New York State, that will close the votes on 19/04/2016, can be forecasted by the up to date RCP average percentage and the percentage of males in the New York state, as an approximation of the male percentage in the future exit poll in the New York state. The percentage of males in the New York state is 48.5% (KFF.org, 2014), which will be taken as the male percentage in the exit polls. Assuming Hillary Clinton will win on the Democratic side and assuming Donald Trump will win on the Republican side, the RCP average of Hillary Clinton is 53.5% on 17/04/2016 and the RCP average of Donald Trump is 52.2% on 17/04/2016, just two days before the final results on Tuesday. Applying the numbers to Equations (3) and (4), if Hillary Clinton is going to win on the Democratic side, she is likely to have 52.6019% of votes; if Donald Trump is going to win on the Republican side, he is likely to have 53.3332% of votes.#p#分页标题#e#
VI. Conclusion总结
In this paper, a multiple regression model is built to business forecast the statewide votes for the winners of each state. The data of statewide votes is treated as the dependent variable and collected from the CNN politics website. The data of the statewide CRP averaged polls is collected from the Clear Real Politics, as one of the explanatory variables. The data of the percentage of males among the voters is collected from the CNN exit polls. A multiple linear regression model is built from 34 observations. The assumptions of the classical linear regression model are tested. The parameters in the multiple regression model are estimated. The hypothesis of the correctness of the estimation of parameters is accepted at the 95% confidence level. Finally, business forecast is made for the New York state primary, which will happen on 19/04/2016 is projected. Assuming Hillary Clinton is going to win the New York state by 52.6019% on the Democratic side and Donald Trump is going to win on the Republican side by 53.3332%, based on the current up to date RCP averaged score and the averaged male percentage in the New York state.
VII. References:Harvard Referencing Style参考文献:哈佛引用样式
CNN politics. (2016). CNN exit polls. CNN 2016 election centre, [Online].
KFF.org. (2014). Population distribution by gender. The Henry J. Kaiser Family Foundation, [Online].
K. Lewis. (2016). Iowa caucus: what’s the difference between a caucus and a primary? Independent, [Online].
Real Clear Politics. (2016). Real Clear Politics election 2016 presidential polls, Real Clear Politics, [Online].
Public Policy Polling. (2016). Public Policy Polling, [Online].
R.K. Roth. (2012). Does the economy determine the president? A regression model for predicting US presidential elections. Undergraduate Economic Review, Volume 8, Issue 1, Article 11, [Online].
L.J. Sabato, K. Kondik, G. Skelley. (2015). 10 Factors that will determine the next president. Rasmussen Reports, [Online].
N. Silver. (2013). Nate Silver’s political calculus. Five Thirty Eight, [Online].
P. Sinha et al. (2012). Prediction for the 2012 United States Presidential Election using multiple regression model, Munich Personal RePEc Archive, No. 41486.
|
| 网站地图 |


