|
Customer Satisfaction Survey Results
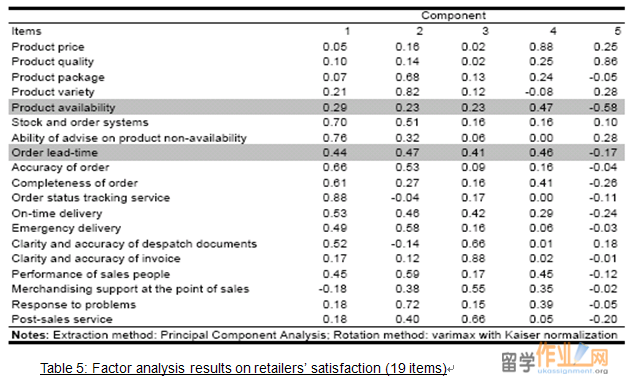
19 customer service items were ranked by retailers. Evaluating items separately can only suggest the level of satisfaction on each item. However, it does not recommended to improve every item which has low satisfaction as the degree of item impact on overall satisfaction varies. More importantly, some items might be correlated strongly with others. Items with high correlation can be grouped as specific characteristic of customer service. Analyzing grouped customer service items is more effective. From this point of view, Principal Component Analysis (PCA) with a Varimax rotation was employed to reduce numerous items to a more manageable set of factors (Aaker and Day, 1986). 5 factors were extracted from 19 items in the initial factor analysis. The results are given in Table 5. It’s noted that not all items load strongly to any factors, especially item Product availability and Order lead-time (below 0.5). To ensure the reliability of data, these two items were deleted.
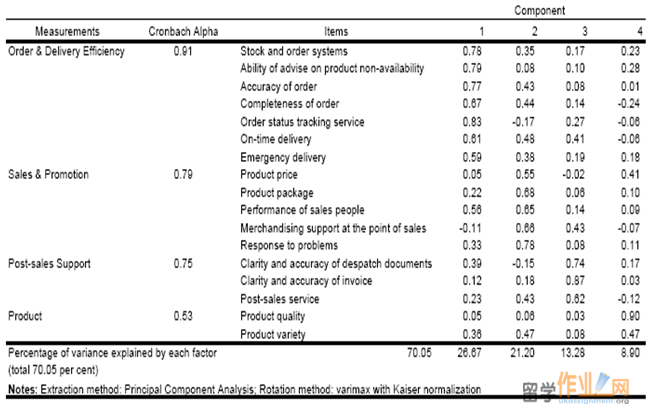
Principal Component Analysis was run again for the retained 17 items. Four factors were generated and accounted for 70.05 percent of the total explained variance (see Table 6). The four factors were:
(1) Order & Delivery Performance
To test the reliability of the extracted factors, reliability analysis was run for each factor. Cronbach’s alpha for the 4 factors were 0.91, 0.79, 0.75, and 0.53, respectively (see Table 6). Considering Cronbach’s alpha criteria (above 0.7), the extracted factors except for factor Product had relatively high reliability and were suitable for further analysis. The reliability of ‘Product’, 0.59, was deemed low. It’s accepted due to considerations of exploratory nature of the present study.
The first factor, Order & Delivery Efficiency including 7 scale items, accounted for the largest proportion (26.67 percent) of the total explained variance. It was primarily related to the concept of providing easy-to-use order system and efficient delivery service.
The second factor, Sales & Promotion including 5 scale items, explained 21.2 percent of the variance. It’s associated with good performance of sales people and attractive sales package.
The third factor, Post-sales Support, accounted for 13.28 percent of the variance. It’s comprised by 3 scale items which are clarity and accuracy of dispatch documents, clarity and accuracy of invoice, and post-sales service.
The fourth factor, Product, explained 8.9 percent of the variance and consisted of two items, including product price and variety.
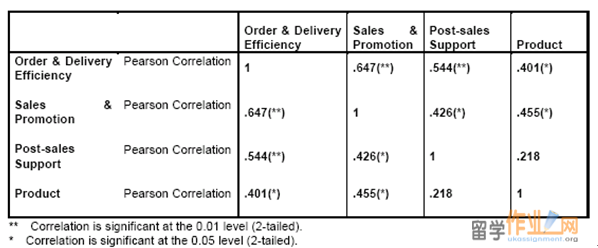
Before carrying on Regression Analysis, degree of the correlations among the extracted factors should be examined. If the correlations are too high, it suggested that two factors may be measure the same customer service characteristic and need to be modified. High cross correlations may violate the results of regression analysis as variables used in regression analysis are required to be relatively independent (Johnson and Gustafsson 2000). The 4 extracted factors were saved as new variables in the data set, a bi-variate correlation analysis was run for them. The correlation between any two factors should not exceed 0.7, and the lower the values the better (Johnson and Gustafsson 2000, p.115). Based on the results of correlation analysis (see Table 7), there were only one correlations above 0.6. It suggests that cross correlation of the 4 extracted factors is not too severer. Data quality meets the requirements of regression analysis.
|
| 网站地图 |