|
Introduction 介绍
本研究将对中型企业中老年男性的健康状况进行数据分析。
主体
男性的年龄分布
柱状图是数字数据分布的精确图形表示(Oakshott,2014)。因此,本研究将使用柱状图来描述男性的年龄分布。年龄的具体柱状图参见图1。
This research will make data analysis on health and well-being of men in mid-life or older in a medium sized company.
Main body
The age distribution of men
Histogram is an accurate graphical representation of the distribution of numerical data (Oakshott, 2014). Thus, this research will use the histogram to describe the age distribution of men. The specific histogram on the age refers to graph 1.
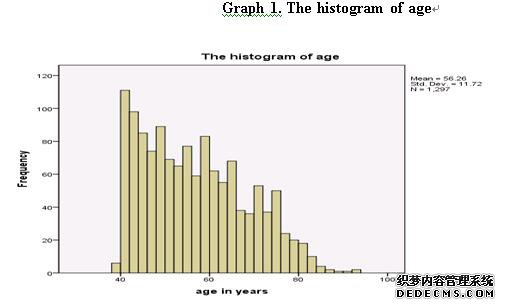
根据柱状图,对男性年龄进行了1297次观察,男性平均年龄为56.26岁。男性年龄的最大频率是从40岁到42岁。超过一半的男性年龄介于40岁到60岁之间。一般来说,随着年龄的增长,男性的年龄频率会降低。因此,男性的年龄分布并不遵循正态分布。
男性的比例属于各自的健康类别
饼图可以直接以图形方式显示每个组件的比例(Swift,2010年)。因此,用饼图来描述男性所占的比例是合适的,这是属于自己健康的每一类,参见图2。Based on the histogram, there are 1297 observations on the age of men, and the average age of men is 56.26. The greatest frequency on age of men lies in the interval from 40 to 42. The age of more than half of men lies in the interval from 40 to 60. In general, the frequency on age of men will decrease with the increase of age. Thus, the age distribution of men does not follow the normal distribution.
The proportion of men belong to each category of own health
The pie charts can directly display the proportion of each component directly in a graphical manner(Swift, 2010). Thus, it is suitable to use the pie chart to describe the proportion of men belong to each category of own health, which refers to graph 2.
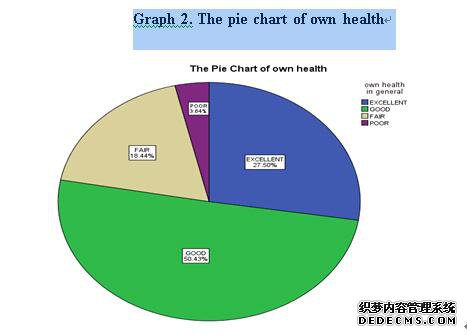
According to graph 2, the proportion of men belong to the categories of excellent, good, fair and poor of own health are 27.5%, 50.43%, 18.44% and 3.64% respectively. In specific, about 77.9% of men have good or excellent health. Only 3.64% of men have poor health.
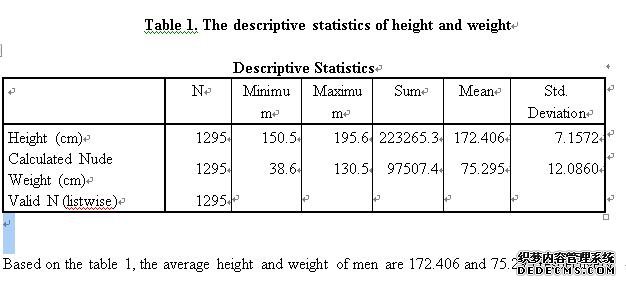
The average height and weight of the men
The Descriptive Statistics analysiscan calculate the average and the standard deviation of variables(Swift, 2010). The descriptive statistics of the height and weight of the menrefer to table 1.
The relationship between lung function (HYFEV) and age
The linear regression model can determine the quantitative relationship between two or more variables(Swift, 2010). Thus, this research will use the linear regression model to discuss the relationship between lung function and age. In order to study how the age affect the lung function (HYFEV), in the linear regression, the dependent variable is lung function (HYFEV), and the independent variable is age. The coefficient table of the linear regression refers to table 2.
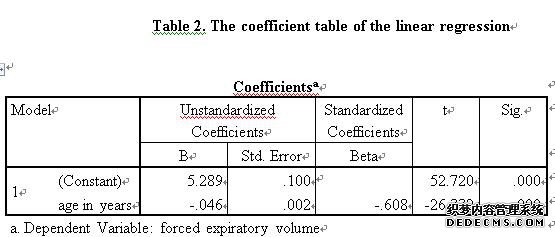
According to the coefficients table of the linear regression, the dependent variable is lung function (HYFEV), and the independent variable is age. The coefficient of the age is -0.046, and the t test statistic of variable age is -26.33. In addition, the sig of the variable age is 0.000, which implies that the P-value of t test on variable age is 0.000. Based on the basic knowledge of t test and the coefficient of variable age is negative, there is negatively significant relationship between lung function (HYFEV) and age, that is, the age in years can negatively significantly affect the lung function. In specific, when the age in years increases by one unit, the lung function will decrease 0.046.
The average FEVS of the different social class categories
The One-way ANOVA is a significant test to analyse the mean difference between two and more categories(Swift, 2010). The null hypothesis of the one way ANOVA is the population average is equal for all categories(Swift, 2010).The results of the one-way ANOVA test of FEVS on social class categories refer to table 3.
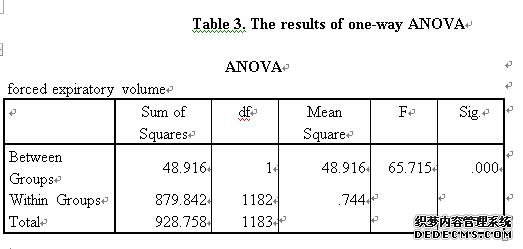
For the ANOVA test on average FEVS of the different social class categories, the null hypothesis is the population average of FEVs between manual and non-manual are equal. However, based on the table 3, the sig of the Between Groups is 0.000, which implies that the P-value of ANOVA test is 0.000. Thus, we can reject the null hypothesis, and the population average of FEVs between manual and non-manual are not equal. In other words, the average FEVs of the different social class categories are significant different.
The proportion of smokers and non-smokers who have poor mental health states
The Chi-square test can determine whether the proportion of different categories is different or not(James, 2006). The results of Chi-square between smever and mstategp refer to table 4.
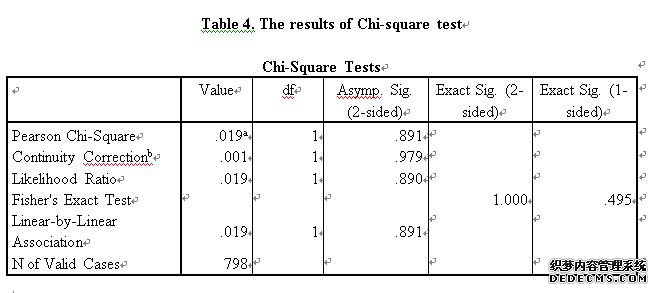
Based on table 4, the value of Asymp. Sig. (2-sided) on Pearson Chi-square is 0.891, which is close to 1. The results of the Chi-square shows that there is no significant difference between the proportion of smokers and non-smokers who have poor mental health state.
Conclusion
To sum up, the average height and weight of men are 172.406 and 75.295 respectively. In addition, there is negatively significant relationship between lung function (HYFEV) and age. Moreover, the average FEVs of the different social class categories are significant different. However, there is no significant difference between the proportion of smokers and non-smokers who have poor mental health state.
Reference
Swift, L. (2010). Quantitative methods for business, management and finance. Palgrave Macmillan.
James M. Wilson. (2006). Quantitative methods for business, management and finance, 2nd ed. Journal of Modelling in Management, 1(1), 85-86.
Oakshott, L. (2014). Quantitative methods. Macmillan.
|
| 网站地图 |


