|
Introduction介绍
石油是现代经济和社会发展的基础,也被称为现代工业的血液。具体而言,原油在每个县的大多数工业生产力和经济发展中起着重要作用。原油供应将导致大多数经济行业停滞不前。对原油“谁占有石油,将拥有整个世界”的重要性进行了高层次的概述。此外,美国是世界上最大的原油交易市场。
Oil is the foundation of modern economic and social development, which is also called as the blood of modern industry. In specific, crude oil plays an important role in most industrial productivity and economic development for every county. The supply of crude oil will cause crashing halt for most industries of the economy. There had been a high-level overview of the importance of crude oil “ Who occupy the oil, will have the whole world”. Moreover, the United States is the greatest crude oil trading market all over the world.
在相应的方面,股票市场被称为宏观经济的晴雨表,它起着经济预测和价值发现的作用。股市的走势也与世界经济的发展周期同步。国民经济发展可以直接决定股市的走势。而且,股市走势也可以直接反映经济发展。许多学者提出原油价格作为支撑经济发展的主要因素,不可避免地与股市有关。原油价格的变化可能在一定程度上影响股市。例如,在第一次石油危机(1973年)爆发后,原油突然从每桶3美元飙升至每桶13美元。然后,SP500指数在1972年至1974年期间下跌了40%(Brown&Yücel,2002)。这些历史事实表明,原油价格与股市密切相关。
In the corresponding aspects, the stock market was known as the barometer for the macro-economy, which plays a role of economic projection and value discovery. The trend of the stock market also simultaneous with the development cycle of the world economic. A national economic development can directly determine the trend of the stock market. Moreover, the stock market trend can also directly reflect the economic development. Many scholars propose crude oil price as the main factor of supporting economic development is inevitably associated with the stock market. The change of crude oil price may affect the stock market to a certain extent. For example, after the outbreak of the first oil crisis (1973), the crude oil was suddenly soared from $3 per barrel to $13 per barrel. Then, the SP500 index fell by as much as 40% during the period from 1972 to 1974 (Brown &Yücel, 2002). These historical facts show that the crude oil price is closely related to the stock market.
该分析侧重于调查原油如何影响美国股市。该测定的结构如下所示。第2节将显示文献综述。第三部分将展示数据描述和许多方法将用于数据分析,如单位根测试,协整测试,VECM和格兰杰因果关系测试。最后,该测定将得出该实证研究的结论并提供一些建议。This assay focuses on investigating how the crude oil affects the stock market of United States. The structures of this assay are shown as follow. Section 2 will show the literature review. The third part will show the data describe and many methods will be used in data analysis, such as, Unit root test, co-integration test, VECM and Granger Causality test. Lastly, this assay will draw the conclusion of this empirical study and provide some recommendations.
Literature Review
In history, there was three dramatic volatility on the crude oil market, which inevitably affects the macro economy of each country. For example, after the outbreak of the first oil crisis (1973), the crude oil was suddenly soared from $3 per barrel to $13 per barrel. Then, the SP500 index fell by as much as 40% during the period from 1972 to 1974.After systematically investigating how the crude oil price affects the stock market, Chen, et al. (1986) believes that the risk of oil price cannot significantly embedded in the return of stock market. However, after analyzing the updated data in the same method, the risk factor of oil market can significantly affect the return of stock market (Kaneko & Lee, 1995). After taking VAR analysis on how the daily yield of oil futures affect the stock market return of United States. According to Brown &Yücel, (2002), the crude oil price can significantly affect the both indictors of GDP and GNP, that is, the relationship between oil market and macro economy is significant. Based on the study of oil crisis from 1973 to 1974 by Darby (1982) and Alpanda& Peralta-Alva (2010), the crude oil can negatively significant affect the macro economy. Moreover, Mork (1989) deeply studies the asymmetrical relationship between crude oil price and macro economy market. He believes that the asymmetrical relationship is significant. However, after studying the monthly data of a mount of industrial sectors, Nandha& Faff (2008) believes the asymmetrical relationship between crude oil price and macro economy market is not significant.
It is clear that the impact of crude oil price on the stock market is significant. However, the crude oil price is also closely related to the macro economy. Thus, this assay will also include many control factors of macro economy. Papapetrou (2001) constructs the VAR model on the monthly data to research the dynamic interaction effect among crude oil price, stock market and factors of macro economy. He claims there is significant bidirectional correlation between crude oil price and stock market. Park &Ratti (2008) focuses on investigating the relationship between the shocks of stock market and the volatility of crude oil price. The results of multivariate VAR model including industrial production, interest rate and the index of stock market show that the crude oil price can positively significant affect the stock returns of the oil exporting county. However, the crude oil price will negatively significant affect the index ofstock market of the oil importing country.
Data and Methodology
3.1 Variable definition
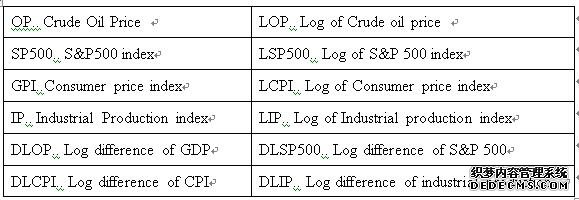
This assay will deeply investigate how the crude oil price affect the stock market of United States with many control variables of macro economy. The time series in this research are monthly data of Consumer price index (CPI), Crude Oil Prices (OP), S&P 500 index (SP500), and Industrial production index (IP) over the period from 2000 to 2014. In specific, the oil price is measured by dollars per Barrel of WTI. The S&P500 index measures the stock market of United States. On the other hand consumer price index and industrial production index are parts of macro economy. These time series are selected form the Federal Reserve Bank. The natural logarithmic form is a good way to eliminate the effect of heteroscedastic. In the following of this assay, all time series are translated to logarithmic form. The variables abbreviations are shown as follow.
3.2 Unit root tests
The phenomenon of unit root is the data in current time spot t equals the data in the previous time spot t-1 plus a random variable ε. If there is unit root, the time series will be unpredictable. This assay will use the ADF test to determine the stationarity of variables of LSP500, LOP, LIP and LCPI. The form of ADF test including constant and trend is
The null hypothesis for the test including constant and trend is H_0:β=δ=0. The form of ADF test without trend is
The null hypothesis is H_0:α=δ=0. If one of the above null hypothesis are rejected, the time series of LSP500, LOP, LIP and LCPIare significant stationary and the order of the integration is 0. However, if the time series of LSP500, LOP, LIP and LCPI are not stationary and the time series of the time series of DLSP500, DLOP, DLIP and DLCPI are stationary, the order of integration is 1.
3.3 Co-integrating test
Engle& Granger (1987) describes the movement of variables connected to each other in the long run. The Co-integrating test can be used to determine spurious regression and research the long run relationship between time series.The general methods for co-integration test are Engle-Granger two step method and the Johansen test. This assay will apply the Johansen test on VECM including trace statistic test and Max-Eigenvalue test. The null hypothesis of both above Johansen test are H_0:r≤r_0.
3.4 VECM
When there exists no co-integration among variables, we can establish the VECM to optimize the VAR model.The VECM sets all series endogenously, which make predicted variable explain itself.
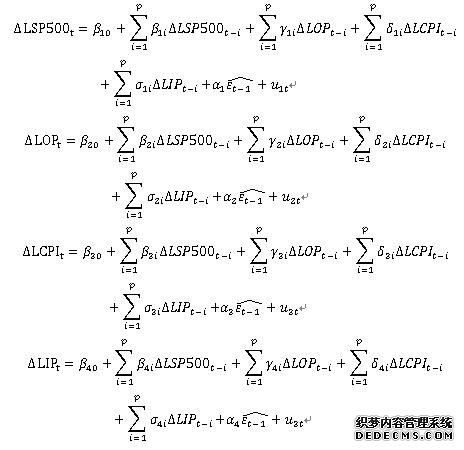
The formula of VECM for each variable are
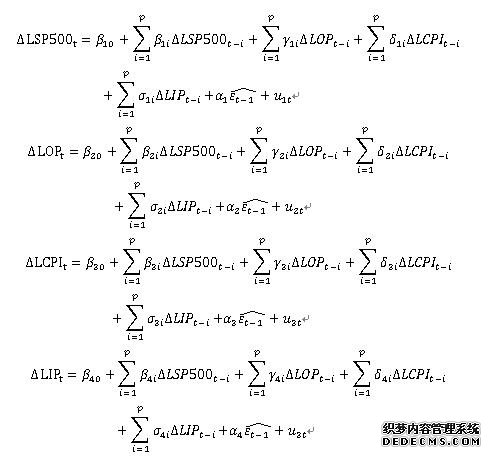
Where ∆ denotes the first lag difference, (ε_(t-1 ) ) ̂ denotes the error correction term, α_1 denotes the short run coefficients, and u_t denotes the white noise.
Empirical results and analysis
4.1 Results of data description and unit root test
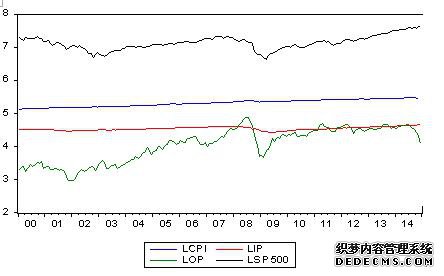
This research will use the monthly data from the Federal Reserve Bank from 2000 to 2014.In the following, the level of significance is 5%. The time series plot of logarithmic form for OP, SP500, CPI, and IP are shown as follow.
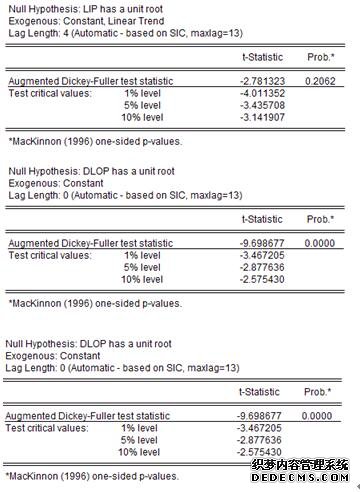
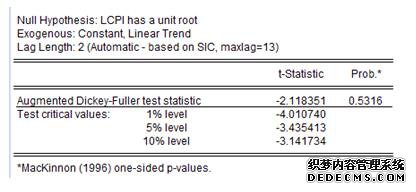
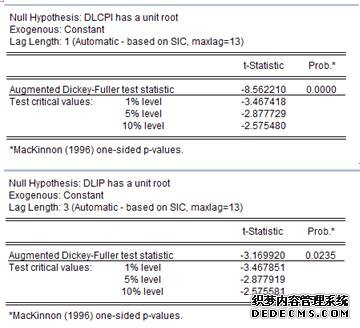
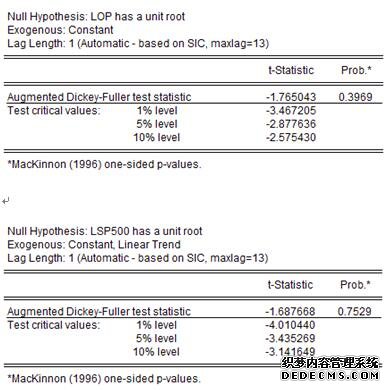
So as to avoid spurious or misleading predictable, the results of unit root test (ADF test) for all variables are shown as follow. #p#分页标题#e#
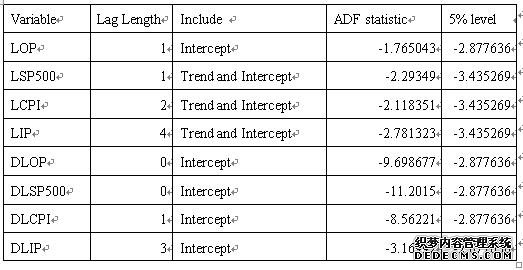
According to the above table, the time series of LOP, LSP500, LCPI and LIP are not stationary. However, the time series of DLOP, DLSP500, DLCPI, and DLIP are stationary. In other words, the time series of LOP, LSP500, LCPI and LIP are I(1) process. According to unit root test, all time series have the same order of integration.
4.2 Co-integration Analysis
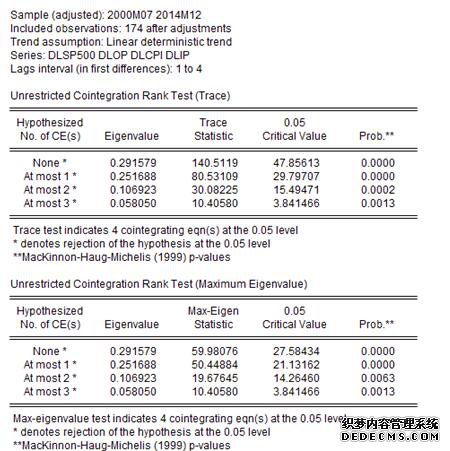
This assay will apply the Johansen test on time series of DLOP, DLSP500, DLCPI and DLIP including trace statistic test and Max-Eigenvalue test. Moreover, all time series of DLOP, DLSP500, DLCPI and DLIP are I(1) process. The results of trace statistic test and Max-Eigenvalue test are shown as follow.
The null hypothesis of rank test is H_0:r≤4. Both the trace statistic and Max-Eigenvalue statistic of rank 4 are larger than the critical value. Thus, the null hypothesis of H_0:r≤4 can be rejected. We can conclude that there are 4 co-integration equations at 5% level. In other words, the movement of S&P 500 index are relative to crude oil price, Consumer price index and Industrial production index in the long run.
4.3 Results of VECM
The formula of VECM for each variables of LOP, LSP500, LCPI and LIPare
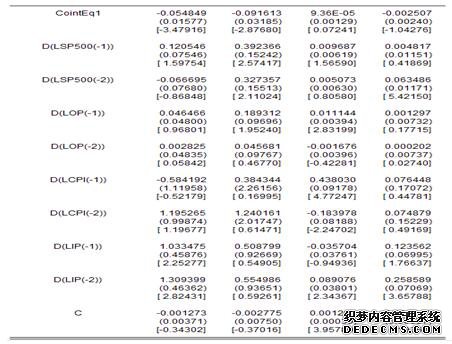
Based on the results of Co-integration analysis, there 4 co-integration equations at 5% level. Thus, the variables have the long run relationship. The results of long run dynamics of VECM are shown as follow.
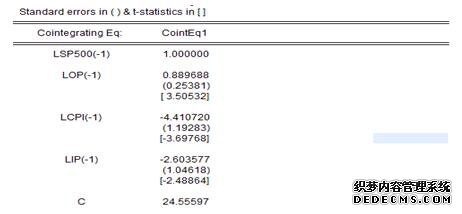
The specific long run dynamics VECM is
LSP500=24.56+0.89*DLOP-4.4*DLCPI-2.6*DLIP
The t statistic of variables LOP LCPI and LIP are 3.5, -3.7 and 2.5 respectively. The absolute value of t statistic are larger than the critical value 1.98. Thus, the variables of LOP, LCPI and LIP can significantly affect the LSP500 at 5% level. The specific results of VECM for variables of LSP500, LOP, LCPI and LIP are shown as follow.
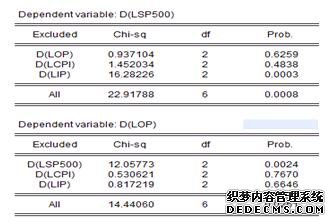
Next, this assay will take Granger Causality test on the VEC, which can determine whether the crude oil had direct effect on the stock market. The results of Granger Causality test are shown as follow.
The null hypothesis of Granger Causality test is H0:X does not the Granger cause for the change of Y. For dependent variable DLSP500, the only the P-value of DLIP is smaller than 0.05. Thus, the industrial production index is the Granger cause for the change of S&P 500. However, the crude oil price and consumer price index are not Granger cause for the change of S&P 500.
On the other hand, for dependent variable DLOP, the P-value of DLSP500 is smaller than 0.05.Thus, S&P 500 index is the Granger cause for the change of crude oil price.
Conclusion
This assay focus on investigating how the crude oil affect the stock market of United States. The time series in this research are monthly data ofOP, SP500, CPI, and IPover the period from 2000 to 2014. Based on the unit root test, the time series of LOP, LSP500, LCPI and LIP are I(1) process, and have the same order of integration. According to the co-integration analysis, there are 4 co-integration equations and all variables have the long run relationship. VECM shows that variables of LOP, LCPI and LIP can significantly affect the LSP500 in the long run. However, the crude oil price is not Granger cause for the change of S&P 500. Only the S&P 500 index is the Granger cause for the change of crude oil price.
Reference
Alpanda, S., & Peralta-Alva, A. (2010). Oil crisis, energy-saving technological change and the stock market crash of 1973–74. Review of Economic Dynamics, 13(4), 824-842.
Brown, S. P., &Yücel, M. K. (2002). Energy prices and aggregate economic activity: an interpretative survey. The Quarterly Review of Economics and Finance, 42(2), 193-208.
Chen, N. F., Roll, R., & Ross, S. A. (1986). Economic Forces and the Stock Market. The Journal of Business, 59(3), 383-403.
Darby, M. R. (1982). The price of oil and world inflation and recession. The American Economic Review, 738-751.
Hamilton, J. (1983). Oil and the Macroeconomy since World War II. Journal of Political Economy, 91(2), 228-48.
Huang, R. D., Masulis, R. W., & Stoll, H. R. (1996). Energy shocks and financial markets. Journal of Futures Markets, 16(1), 1-27.
Kaneko, T., & Lee, B. S. (1995). Relative importance of economic factors in the US and Japanese stock markets. Journal of the Japanese and International Economies, 9(3), 290-307.
Mork, K. A. (1989). Oil and the macroeconomy when prices go up and down: an extension of Hamilton's results. Journal of political Economy, 740-744.
Nandha, M., & Faff, R. (2008). Does oil move equity prices? A global view.Energy Economics, 30(3), 986-997.
Papapetrou, E. (2001). Oil price shocks, stock market, economic activity and employment in Greece. Energy Economics, 23(5), 511-532.
Park, J., &Ratti, R. A. (2008). Oil price shocks and stock markets in the US and 13 European countries. Energy Economics, 30(5), 2587-2608.
Appendix
Appendix 1. Unit root
|
| 网站地图 |