|
曼城斯特城市大学课程工作任务的文章标题是:英国绿色业务数据,测试Modiglianni和米勒(M&M)的债务无关的假设。借款及其他融资来源之间的平衡是一个长期运行的辩论融资(见讲义,课本等)。我个人的看法是,借款为不断增长的业务是一个好主意,但理论探讨的主题(M&M)的结论是,贷款没有什么区别,甚至可以是有益的,如果他们减少税收。需要你收集到数据从20英国绿色商业公司(广义)和测试借贷对股票价格的影响。 Testing the Modiglianni & Miller against green business data The essay title for your course work assignment is: using UK green business data to test Modiglianni and Miller’s (M&M’s) debt irrelevance hypotheses. The balance between borrowing and other sources of finance is a long running debate in finance (see lecture notes, text books etc). My personal view is that borrowings are a bad idea for a growing business, but theoretical discussion of the topic (M&M) has concluded that borrowings make no difference, and can even be beneficial if they reduce taxation. I want you to collected data from twenty UK green business companies (broadly defined) and test the impact of borrowings on share prices. You will find a list of suitable companies in my document ‘Window on green business research’. You must select any twenty but be aware that some companies are smaller and less well established than others. Chose your companies to maximise the reliability and relevance of conclusions. I want you to access, through the MMU library, the financial analysis made easy (FAME) database and down load the profit and loss account and balance sheet for 2010, 2009, 2008 (go back to 2007 if 2010 data is unavailable). From yahoo finance I want you to down load the monthly share prices of the same three years. Many companies have similar sounding names, so take great care to ensure that you download the right company’s data. You can access the company’s website to double check that you have the right data. At this stage it is worth making a note of the company’s year end as this will be useful when calculating the share price percentage data. I will be checking that you have handled all this data correctly and, in order to do this, I want you to set out the data in a single spreadsheet. Each company’s FAME data should be in a single work sheet, and therefore you will have twenty worksheets within a single spreadsheet file. To ensure consistency place the Profit and loss account in row 1 and balance sheet in row 75. Make sure that every company’s results are fully downloaded and that consistent cell references are imposed e.g. every companies sales figure for 2010 should be in cell b7, 2009 sales will be in c7 etc. Have a look in my green business data 12.xls spreadsheet and you will see what I mean Put all the share price data in another worksheet, one column for each company using the same order as the FAME downloads. Put all your results in a results work sheet. In total your spreadsheet should contain 22 worksheets. Make sure the worksheets are all named clearly so I can find them and check them.
Make sure you use formula to put all the data together. To save time, once you have established the formula on the first company copy it into the next company and the results should come up automatically. Double check everything to make sure you make no mistakes with the numbers. Do not input the data manually or you will loose half the marks available for the spreadsheet workings. Take great care with negative numbers.
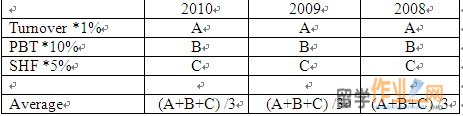
To get an estimate of company size, one approach that I have used in the past is calculating an index of size by first calculate sales * 1% and then calculate profit before taxation * 10% and then calculate Shareholder funds * 5%. The average of the three figures gives you a summary statistic which robustly measures the size of the company. If this size measure takes a negative value double check the calculations. Again use formula here, do not input the data manually and once the formula is established in the first company, copy into the second company, and so on. Calculate a size index as follows:
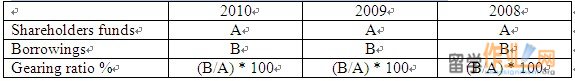
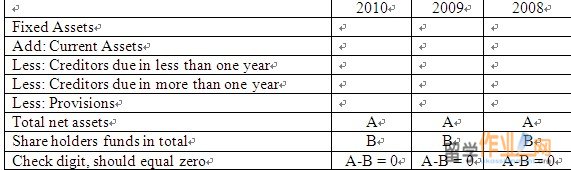
Gearing ratio can be calculated as: (Loans divided by shareholders funds)*100 = Gearing ratio
Set out the gearing ratio calculation for every company as follows:
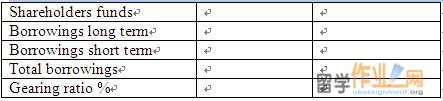
Repeat the process using both long term and short term borrowings
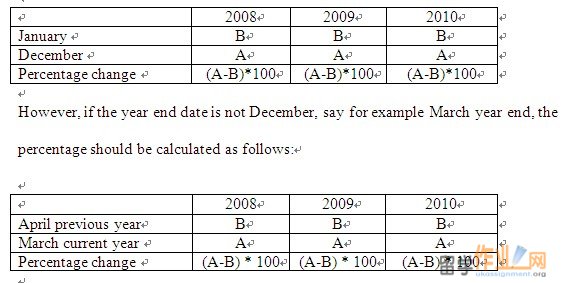
In a separate worksheet download monthly share price data for 2007, 2008, 2009, 2010 if it is available. Check that you have 48 observations per company. If the companies you have chosen have a year end of December (not all of them will), the share price percentage can be calculated as shown below: You will now be in a position to bring together all the evidence you have collected. This is what I want you to do next:
1. Produce a table of the final results showing the gearing ratio in a given company and year and the share price movement in that year. Make sure you match up the gearing ratio of the company and year with the right share price change. A suggested structure for the essay is as follows: introduction; short literature review of M&M; size ranking results; check digit results; limitations of the data available; summary table of gearing results; summary table of share price results; graphical presentation; correlation results; discussion of results; conclusions. In addition to the essay I want you to email your spreadsheet to me so that I can check your figures and link them to the results in your essay. M&M theories have played a major role in finance and I am looking forward to seeing if this type of evidence can determine the validity or other wise of the theory. My instinct is that the theory is wrong, but what does the evidence show? The marking scheme will identify the following points
o Setting out downloaded data from FAME in your spreadsheet
Do not write more than 3,000 words. The deadline for submission is Thursday 19th January 2012. |
| 网站地图 |
 Put this data in row 200. In addition, to give a feel for the relative size of the companies involved, using the 2010 data, put the companies in size order, biggest company first, smallest company last. The ranking should be in the results worksheet.