|
ABF305 Investment Management
ABF305投资管理
Lecture 19
第19讲
For this lecture:
对于这次讲座:
In this lecture, we will look at Technical Analysis (or charting).
在本次讲座中,我们将着眼于技术分析(或图表)。
The relevant chapter is Chapter 12 in your textbook, and the pages you need to read are 395-404.
在你的教科书是第12章的相关章节,你需要阅读的页面395-404。
Technical analysis is the study of patterns using past such as stock prices and also volume.
技术分析是研究的模式,利用过去的,如股票价格,成交量也。
Technical Analysis is used:
使用的技术分析:
To predict future returns or future stock price movements.
Identify mispriced securities.
For timing, namely when to buy and when to sell. The idea is to look both for the timing of investments, when to buy and when to sell and also opportunities of where to invest.
Technical analysis should be a complete waste of time….
技术分析完全是浪费时间
According to the efficient market hypothesis there is not supposed to be stock mispricing nor predictability in future price movements. Stock prices, are random. However, because of conservatism and the disposition effect, markets demonstrate a sluggish or slow response to stock prices and it is this slow response which translates into a momentum price which is key to successful technical analysis.
The two broad main types of analysis are:
分析的两大主要类型是:
Recurrent and predictable stock price patterns.
复发性和可预测的股票价格模式。
Market buy or sell pressure.
市场买进或卖出的压力。
Dow Theory:
The Dow Theory is a method for predicting market direction that relies on the Dow Industrial and the Dow transportation averages.
This theory posits that there are three simultaneous forces affect stock prices.
There is the primary trend, a secondary or intermediate trend, and a tertiary or minor trend.
The primary trend represents the long-term price movement (several months to several years) while the secondary trend is caused by short-term deviations of the price from the underlying primary trend. The third or tertiary trends represent daily fluctuations.
An example chart downloaded from the Australian Stock Exchange:
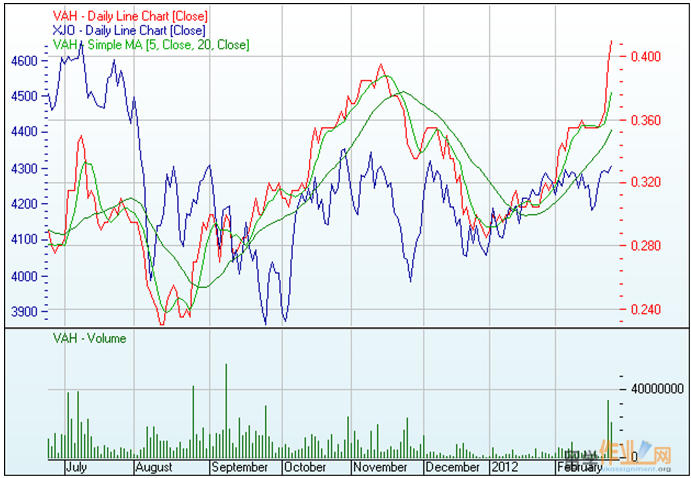
It should be noted that the interpretation of technical analysis lies with the analyst. The same chart may be interpreted differently depending on the trader and also the intended time frame.
应该指出的是,技术分析的解释在于分析师。在同一个图表可以有不同的解释根据贸易商和预定的时间框架。
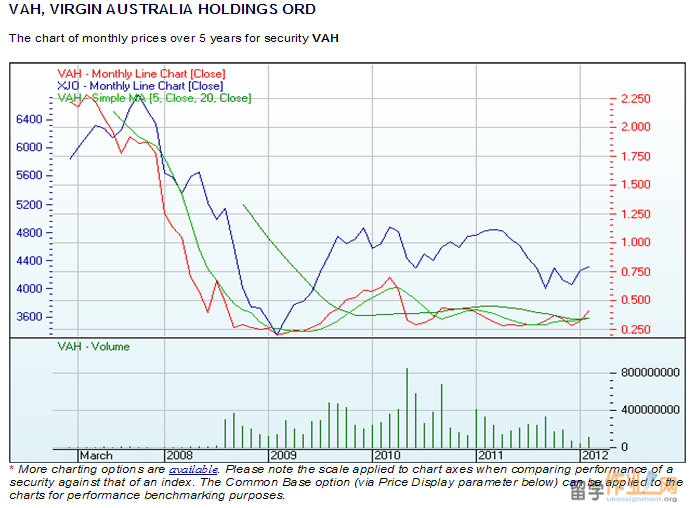
A changed time frame:
一个改变的时间框架:
Moving averages.
移动平均数
A moving average is a smoothed version of the original stock price data. It therefore removes noise from the market.
移动平均数是一种平滑的原始股票价格数据。因此,从市场上消除噪音。
A moving average (n) is = [price(n) +price (n-1) + price (n-2) +…+(price n-m)]/m
Where N is the current period,
Price is the closing price
M is the parameter selected by the user (e.g.5 days)
M is the number of samples used to construct the indicator.
When calculating the next value, drop the oldest value and add the most recent.
Two popular measures are the 50-day, 200-day and 53-week moving averages. The 200-day indicator is considered a long term indicator.
Moving averages usually have a minimum 3 period indicator.
Moving average uses:
They are used to indicate a change in trend directions. How they do that is when the moving average lines cross over. The moving average sequence is where the short term indicator is above the long term indicator and there is an overall upward. If the moving average line changes and it crosses over, so that the longer term moving average is above the short term indicator and the trend is downward, then this signals the trend direction is changing.
The moving averages work best when there is a clear trend. If the share price movement is sideways and directionless then the moving average is not a good indicator to use. Instead a derivation of the moving average is used which is the moving average convergence divergence indicator or MACD for short.
There are several types of moving averages.
A simple moving average.
A weighted moving average. Use of an indicator which attributes more weight to the more recent data observations is called a weighted moving average.
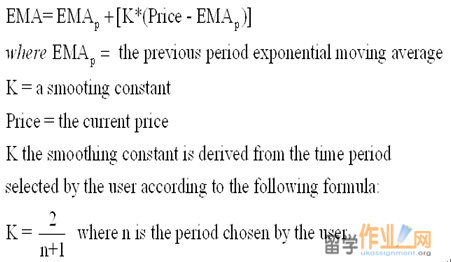
An exponential moving average (EMA) is determined by:
The moving average convergence divergence indicator (MACD).
The MACD is determined using exponential moving averages (EMA). There are two exponential moving averages determined: one is for 12 and the other is for 26 periods.
The MACD employs a crossover method and also divergence and convergence of the two lines.
Analysis which looks at patterns and chart formations are:
Trendlines;
Trend channels;
Support and resistance;
Triangles;
Pennants;
Flags;
Double tops and bottoms;
Head and shoulders.
Buy/Sell Market pressure.
Relative Strength Indicator.
Bollinger Bands.
Volume.
Relative Strength Indicator ≠ Relative Strength Chart.
Relative strength charts are used to illustrate the performance of one company, industry, or market relative to another.
A relative strength indicator is a front weighted, price velocity, ratio indicator which is used to measure the recent strength of relative to its past strength for an asset. The RSI is used to indicate when something is overbought or oversold.
End of Lecture
|


